Desmos for Economics
In November 2024, I conducted a short seminar for Econschool on using Desmos to build interactive visualisations for economics. The motivation was simple: many optimization problems become much easier to understand when parameters can be adjusted dynamically and their effects observed immediately.
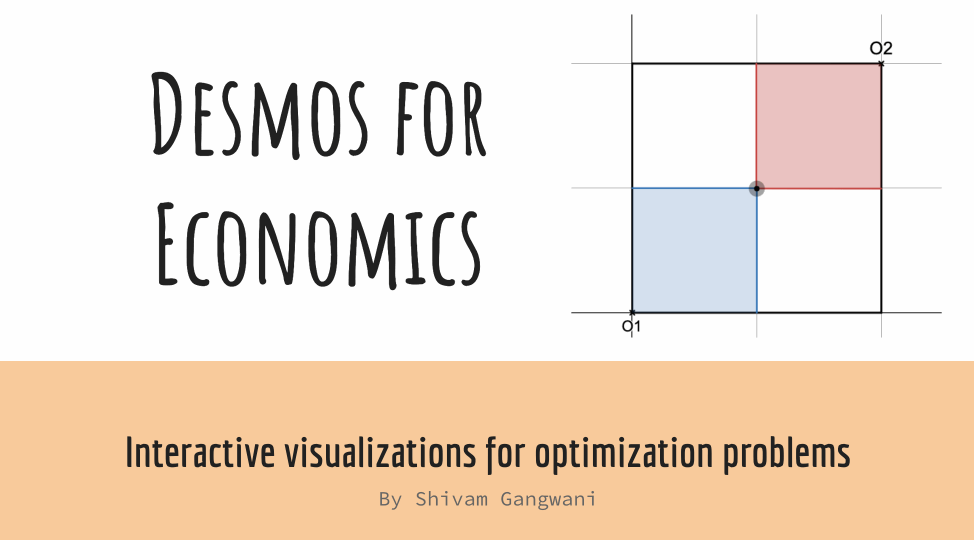
The seminar demonstrates how Desmos can be used to visualise ideas such as constrained optimization, utility maximization, production functions, and comparative statics. While Desmos is often viewed as a graphing tool for school mathematics, it is surprisingly powerful for building intuitive, interactive models of economic concepts.